
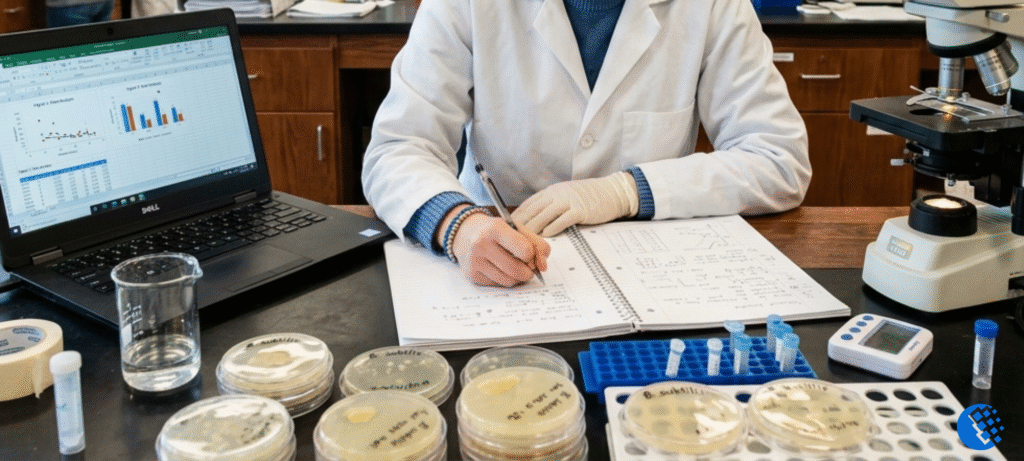
Walking into a biology lab is always the fun part. But sitting down at your desk later to write up the actual report? That’s usually when the headache starts. If you’re staring at a blank document trying to figure out how to organize your data, don’t panic. You are definitely not the first person to get stuck here. Honestly, reading through real examples of a lab report biology students have already written is the fastest way to understand what your teacher actually wants to see.
A solid lab report shouldn’t read like a boring, robotic textbook. When you try way too hard to sound “scientific,” you usually just end up with confusing sentences and messy data descriptions. Your main goal should be simple, clear communication. Just explain what you wanted to test, how you actually did it, what happened, and why any of it matters.
Whether you need to follow specific guidelines from your syllabus or you are just trying to survive your first major science course, this guide will clear up the confusion with real, practical examples.
What Is a Biology Lab Report?
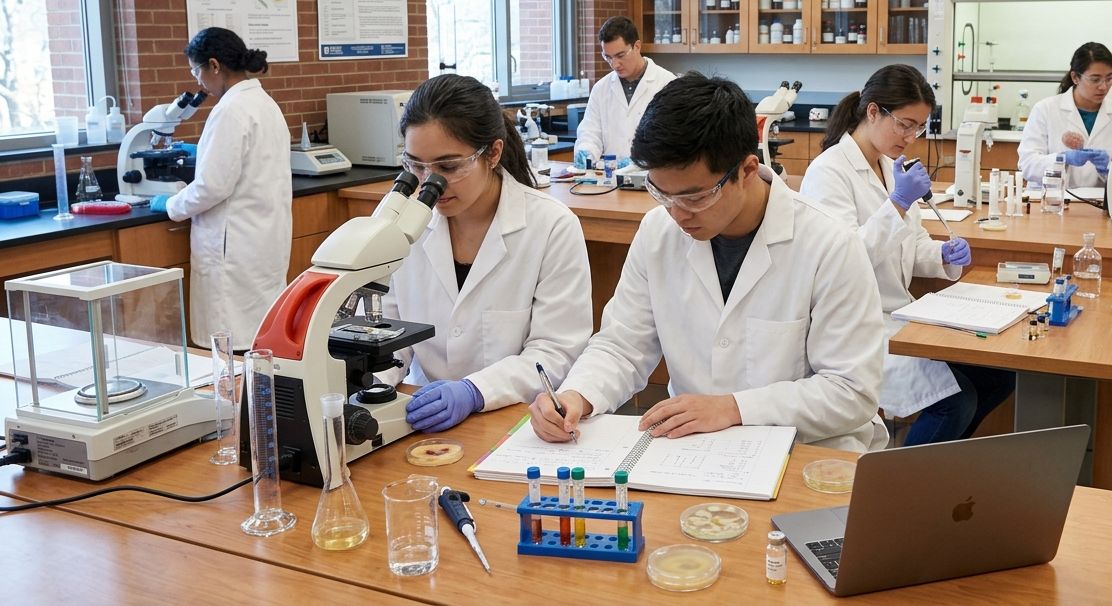
At the end of the day, a biology lab report is just a structured story about a scientific test. It’s the standard tool researchers use to share their findings with the rest of the science world. Look at it like a detailed kitchen recipe mixed with a thoughtful review. You need to give people the exact steps to copy your experiment, but you also have to explain the meaning behind the results.
In your science class, these assignments do two main jobs. First, they force you to actually use the scientific method—taking you from a quick observation to a real prediction, and then on to gathering and reading data. Second, they teach you how to back up your claims. You can’t just tell your teacher that a plant grew fast or a solution changed color. You have to prove it with numbers, charts, and clear context.
Mastering this layout also makes reading professional science papers a lot easier. The moment you figure out how to piece one of these papers together, you start reading like a scientist. It clicks pretty quickly that biology isn’t just a mountain of dusty, old facts trapped inside a giant textbook. You realize it’s actually a massive, ongoing debate happening in the real world—one that relies entirely on researchers sharing fresh data and proving their points with cold, hard evidence.
Standard Biology Lab Report Format
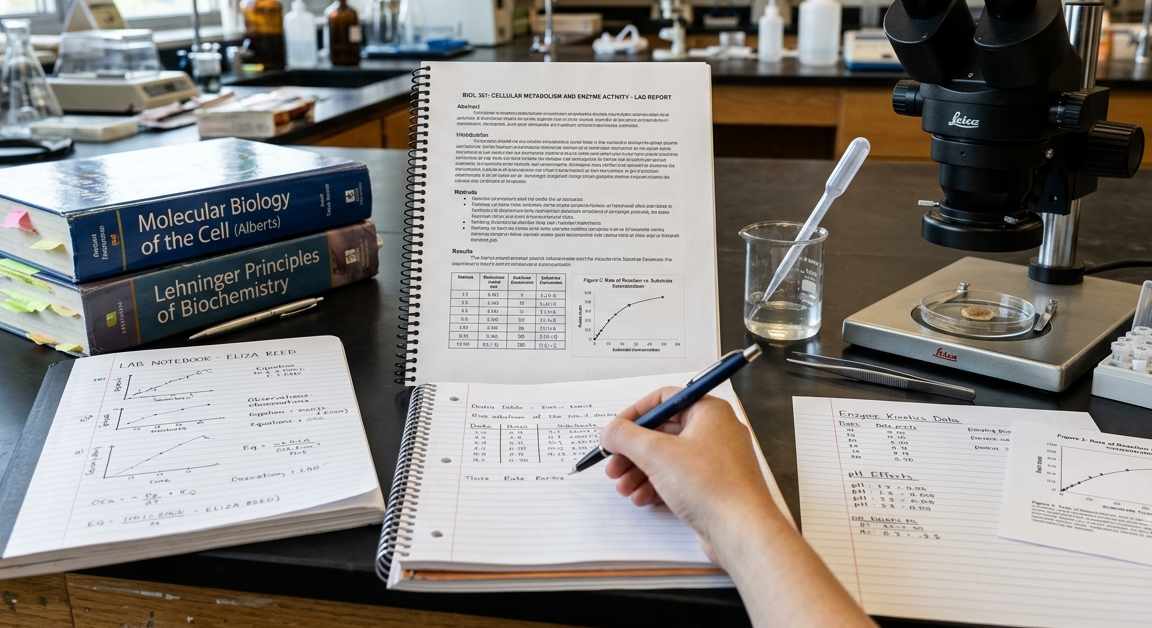
Even though professors love to drop their own unique formatting twists on you, almost every science department runs on the exact same layout. Whether you are trying to match the rigorous formatting rules found in advanced course guidelines—like Dr. Eric Battaglioli’s biology syllabus—or just survival-writing your first major science paper, using a pre-made framework saves hours of frustration. To get your layout right on the first try, jump straight down to our comprehensive biology lab report template to map out your sections seamlessly.
This quick table shows exactly how a standard report breaks down, what belongs in each part, and where to focus your writing energy.
The Anatomy of a Scientific Paper
| Section Name | What It Does | Why It Matters | Conversational Goal |
|---|---|---|---|
| Title | Names the study | Gives immediate context | Tell the reader exactly what species and variables you tested. |
| Abstract | Summarizes everything | Acts as a quick preview | Condense your entire paper into one short paragraph for busy readers. |
| Introduction | Builds background | Sets up the hypothesis | Explain the underlying biology concepts and what you predicted would happen. |
| Methods | Explains the setup | Allows for replication | List your tools and steps clearly, like an instructional manual. |
| Results | Shows the data | Displays objective facts | Present your numbers, tables, and charts without adding any opinion. |
| Discussion | Analyzes the trends | Interprets the meaning | This is where you explain the why behind your numbers and address mistakes. |
| Conclusion | Wraps up the paper | Final take-home point | Give a quick, one-paragraph summary of your ultimate findings. |
| References | Credits your sources | Prevents plagiarism | List the textbooks, lab manuals, or papers that helped you write the report. |
A Complete Sample Biology Lab Report
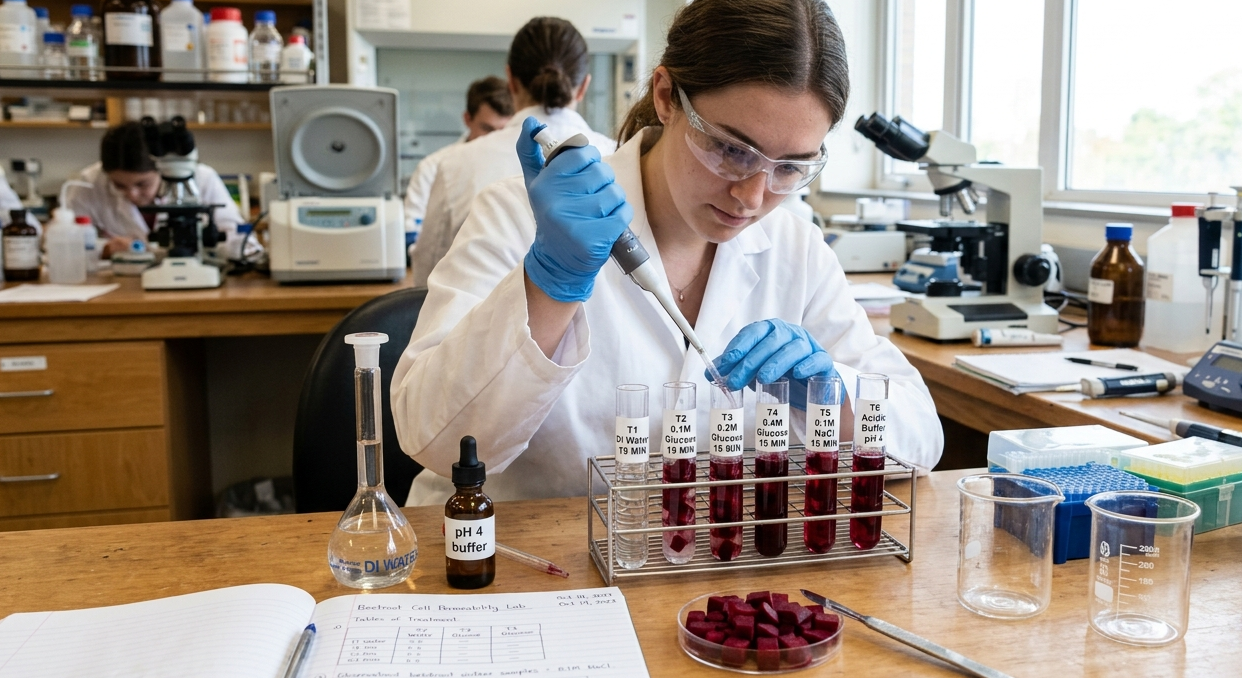
Let’s look at an authentic example of a biology lab report that handles data clearly without sounding robotic. This specific test checks how alcohol concentrations affect cell membranes using beet root tissue. The wording here is accurate but smooth, skipping the dense, over-complicated phrasing that makes academic writing feel fake. It serves as an excellent blueprint when you’re searching for clear examples of a lab report biology teachers can easily grade.
Title: The Effect of Ethanol Concentration on Cell Membrane Integrity in Beta vulgaris
Prepared by: Marcus Vance
Lab Partners: Sarah Jenkins, David Cole
Course: General Biology II (BIO-152)
Date: March 12, 2026
Abstract
This lab tested how different concentrations of ethanol affect cell membrane stability in Beta vulgaris (common beetroot). We placed beet tissue cylinders into five separate ethanol solutions (0%, 10%, 20%, 40%, and 50%) for 30 minutes. We measured membrane damage by tracking how much betalain pigment leaked into the liquid using a spectrophotometer set at 525 nm. The data showed that higher alcohol concentrations led to much higher light absorbance values, which means the membranes broke down severely. The control setup (0% ethanol) had almost no pigment leakage (0.04 au), but the 50% ethanol group maxed out at an average absorbance of 0.88 au. These findings show that organic solvents dissolve the lipid bilayer, destroying the cell’s boundary.
Introduction
Look at any living cell, and you’ll find it wrapped tight in a double-ply sheet of fatty lipids called a phospholipid bilayer, which comes peppered with specialized proteins.This boundary acts as a strict, picky checkpoint—constantly deciding what gets a pass to cross over so the cell’s internal chemistry stays balanced.
Beetroot cells (Beta vulgaris) add a colorful wrinkle to this setup because their internal storage tanks, or vacuoles, hold a dark red, water-soluble pigment known as betalain. In undisturbed, healthy plant tissue, a dual-layer security system—the vacuole’s own tonoplast membrane working alongside the cell’s outer plasma membrane—safeguards that bright red juice from ever leaking out.
But outside stressors can easily destroy this lipid structure. Organic solvents like ethanol interact directly with lipid molecules. Because alcohol is amphipathic, it forces its way into the hydrophobic center of the bilayer. This action makes the membrane way too fluid until the lipids dissolve completely.
We ran this experiment to see exactly how much damage different percentages of alcohol cause to these cell boundaries. We predicted that if we expose beetroot tissue to higher concentrations of ethanol, the pigment leakage will increase in a straight, predictable line. Higher amounts of alcohol should destroy more of the membrane lipids, letting more red pigment spill out into the tube.
Materials and Methods
- 1 fresh beetroot (Beta vulgaris)
- Size 4 cork borer and a sharp razor blade
- 5 test tubes with 10 mL of assigned ethanol solutions (0%, 10%, 20%, 40%, 50%)
- Vernier SpectroVis Plus Spectrophotometer (525 nm)
- Cuvettes, Kimwipes, and a digital timer
To start the setup, we grabbed a cork borer and punched five matching cylinders out from the middle of our beetroot sample. Next came trimming them down—we used a fresh razor blade to make sure each plug measured precisely 1.5 cm in length. Because cutting the tissue breaks open cells and lets pigment spill out everywhere, we ran the finished cylinders under cold distilled water for a solid two minutes to thoroughly wash away that excess red dye before starting the actual trials.
After that, we dropped one beet cylinder into each of the five test tubes filled with the different alcohol solutions. We let the tubes sit completely still at room temperature (21∘C) for exactly 30 minutes. Right at the 15-minute mark, we swirled each tube gently for three seconds to make sure the solution mixed evenly.
When the 30 minutes ended, we pulled the beet cores out with forceps to stop the reaction. We poured liquid samples into clean cuvettes. We set the spectrophotometer to zero using a blank solution, then checked and wrote down the light absorbance numbers at 525 nm.
Results
You could easily see the color change in the solutions during the lab. The 0% alcohol tube stayed perfectly clear, while the tubes with higher concentrations turned a darker, richer red.
Table 1: Absorbance Values at 525 nm Following Ethanol Exposure
| Ethanol Concentration (%) | Trial 1 Absorbance (au) | Trial 2 Absorbance (au) | Trial 3 Absorbance (au) | Average Absorbance (au) |
|---|---|---|---|---|
| 0% (Distilled Water Control) | 0.03 | 0.05 | 0.04 | 0.04 |
| 10% Ethanol | 0.12 | 0.15 | 0.11 | 0.13 |
| 20% Ethanol | 0.28 | 0.31 | 0.26 | 0.28 |
| 40% Ethanol | 0.59 | 0.64 | 0.61 | 0.61 |
| 50% Ethanol | 0.85 | 0.91 | 0.88 | 0.88 |
[Graph Figure 1: Insert a clear scatter plot here showing Ethanol Concentration on the X-axis and Average Absorbance on the Y-axis. The data points show a sharp upward curve as concentration increases.]
Discussion
The numbers backed up our prediction perfectly. When the alcohol level climbed from 0% up to 50%, the average light absorbance jumped from 0.04 au to 0.88 au. Because higher absorbance numbers point to a much darker red fluid loaded with leaked pigment, the numbers clearly show that alcohol wrecks the cell membrane’s structure.
Biologically, this happens because ethanol goes to work on the fat molecules forming the cellular barrier. Phospholipids rely on weak hydrophobic bonds to hold their shape, so when alcohol enters the environment, it disrupts those fragile links and causes the entire membrane to disintegrate. At the highest levels (40% and 50%), the alcohol probably unravels the membrane proteins too, completely destroying the barrier.
We did notice a couple of small bumps in our data. For instance, Trial 2 in the 50% group hit 0.91 au, which was a bit higher than the other tests. This probably happened because that specific beetroot slice was cut slightly thicker by hand, meaning it had more cells and more total pigment to lose. To fix this mistake next time, we should use a real mechanical cutter instead of a razor blade so every single piece is completely identical.
Conclusion
To wrap things up, our experiment proves that putting beetroot tissue in higher concentrations of ethanol increases cell membrane leakage. The jump in light absorbance confirms that organic solvents cause real, visible structural damage to phospholipid layers.
References
- Urry, L. A., & Cain, M. L. (2021). Campbell Biology (12th ed.). Pearson.
- Laboratory Manual for General Biology II. (2026). Cellular Structures and Membrane Transport. Department of Biological Sciences.
Section-by-Section Explanation: Why This Sample Works
If you want to know why this specific example of a biology lab report would pull an easy ‘A’, it comes down to how each section stays focused. There is zero fluff here.
The Title and Abstract
The title doesn’t just say something lazy like “Beet Lab.” It names the exact scientific species (Beta vulgaris) and clearly points out both the independent variable (ethanol concentration) and the dependent variable (membrane integrity).
The abstract works because it is short and sweet. In just a few sentences, it answers the only questions a reader cares about: Why did you do this? How did you do it? What did you find? What is the final conclusion? It includes real data points (0.04 au vs. 0.88 au) instead of just saying “the numbers changed.”
The Introduction and Hypothesis
A huge mistake many students make is dropping their hypothesis onto the page without any setup. Think of your introduction as a funnel. You want to open up wide by laying out the big-picture biology concept—in this case, how cell membranes operate as protective barriers. From there, you narrow your focus down to the specific organism sitting on your lab bench, which is the beetroot and its distinct red pigment. Finally, you taper down to the very bottom of the funnel by making a sharp, calculated prediction about what will actually happen during the experiment.
Writing Tip: Keep your hypothesis in a direct “If… then…” format. It forces you to state exactly what you are modifying and what you expect to see as a direct result.
The Methods: Clear and Simple
Look at the Methods section in our sample above. It reads like a clear instruction manual, not a personal journal. Keep things objective and easy to follow. Don’t write stuff like: “Then Sarah handed me the blade and I tried to cut the beet evenly.” Instead, keep it simple: “The cylinders were trimmed to exactly 1.5 cm.” Give people the exact tools, times, and amounts so they can copy your steps.
Results vs. Discussion: Separate the Facts from the Explanations
Keeping your Results and Discussion sections completely separate is tough but necessary. Think of your Results part as an honest reporter: just share the raw facts and numbers exactly as you found them.
- Right Way: “The 50% ethanol solution reached an average absorbance of 0.88 au.”
- Wrong Way: “The 50% solution hit 0.88 au because the alcohol ruined the cell walls.”
Save all your explanations for the Discussion section. That’s the spot where you get to step back, talk about what the numbers actually mean, connect your data to the lessons from class, and talk honestly about any mistakes or weird data points.
Fill-in-the-Blank Biology Lab Report Template
When you sit down to write your own paper, use this basic blueprint to map out your sections. It matches the format recommended by top university writing labs.
Title: The Effect of [Independent Variable] on [Dependent Variable] in [Organism Name]

1. ABSTRACT
- Explain the biological problem or question you are looking at.
- Mention the main tool or method you used to get data.
- Share your most important numbers and findings.
- Write one final, clear wrap-up sentence.

2. INTRODUCTION
- Big Picture Biology Concept: [Explain the general theory here]
- Specific Context: [Explain how your test organism fits into the picture]
- Goal: The main purpose of this lab was to...
- Hypothesis: If [change in independent variable], then [predicted result] because [biological reason].

3. MATERIALS AND METHODS
- Tool List: [Bullet points of your equipment and chemical solutions]
- Steps:
  1. The sample was set up and prepared by...
  2. We isolated the variables by...
  3. We took measurements every [time frame] using [tool]...

4. RESULTS
- Data Summary: [1-2 paragraphs describing the main trends you noticed]
- Table 1: [A clean grid showing headers, numbers, and metric units]
- Figure 1: [A clear, labeled graph showing the main data trend]

5. DISCUSSION
- What the Data Means: Our findings show that... This makes sense because...
- Connection to Class: According to standard biology rules...
- Error Analysis: One thing that caused variation was... We could fix this next time by...

6. CONCLUSION
- To wrap things up, our hypothesis that [restate hypothesis] was [supported/rejected] because the data clearly showed...

7. REFERENCES
- [List your textbook, lab manual, or online sources in standard APA format]
4 Common Mistakes First-Year Biology Students Make
- Treating a Hypothesis Like a Guess: A hypothesis isn’t a random shot in the dark. It is an educated prediction based on biology rules you already know. Always explain why you expect a certain result using your background notes.
- Forgetting the Metric Units: Writing down that a plant grew “5” or an absorbance read “0.4” doesn’t mean anything. Always include your exact units (5 mm, 0.4 au, 22∘C).
- Claiming Your Data “Proves” a Whole Theory: A single two-hour classroom experiment isn’t going to prove an entire scientific law. Keep your language humble. Say your data supports the hypothesis or aligns with current biology principles.
- Hiding Your Mistakes: Lots of students think that if their experiment doesn’t match the textbook perfectly, they’ll fail. Teachers actually prefer to see smart error analysis. If your data looks weird, just explain why you think it happened and how you would fix it next time.
Frequently Asked Questions
What is the difference between qualitative and quantitative data?
Qualitative data looks at visual descriptions, like a leaf turning yellow or a liquid bubbling. Quantitative data is all about hard numbers and real measurements, like tracking weight changes in grams or timing a reaction in seconds. Good reports use both, but rely mostly on numbers.
Can I write my lab report using first-person pronouns?
It depends completely on your teacher’s rules. While modern scientific journals are totally fine with first-person words (“We observed…”), many introductory high school and college courses still want you to use the third-person passive voice (“It was observed…”). Check your assignment sheet to be safe.
How long should each section of the report be?
Keep your Abstract to a single paragraph (150–250 words). Your Introduction and Discussion sections are usually the longest parts because you need several paragraphs to explain the background and read into the trends. The Conclusion should be a short, simple wrap-up paragraph.
Where should I put extra data that doesn’t fit on my main charts?
If you have massive pages of raw numbers or long mathematical calculations, put them in an Appendix section at the very end of your paper, right after the References page.
Wrapping Up Your Report
Writing a strong paper is a lot easier when you have realistic examples of a lab report biology teachers actually enjoy reading. Don’t worry about trying to sound like a genius professor. Just focus on making your steps easy to follow and your data numbers completely accurate. If you treat your report like a clear, step-by-step tour of your lab journey, you’ll turn a stressful writing chore into a simple, straightforward project. Keep your layout neat, stay honest about any lab mistakes, and let your numbers tell the story.
You can find us here=> easygrader